The stress-strain curve is one of the graphs often used in material testing. This curve occurs when the load is gradually applied to the test material (specimen) and it will measure the deformation, from which the stress and strain can be determined. The curve shows many material properties such as Young’s modulus, the yield strength and the ultimate tensile strength.
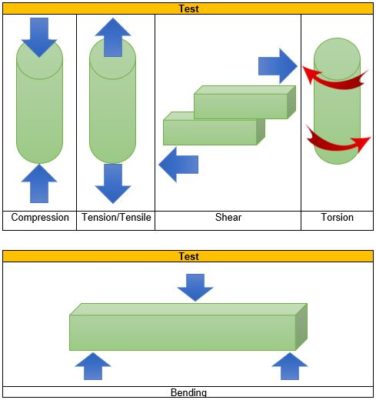
For your information, this curve represents the relationship between stress and strain. The stress and strain can be normal, shear or mixture and also can be uniaxial, biaxial, or multiaxial, even change with time. The deformation form can be compression, stretching, torsion, rotation, and so on.
The test that will form the stress-strain curves
What is Stress?
Stress is defined as the ratio of the applied force to the cross-sectional area of the material it is applied to.
The formula for calculating stress in material testing:
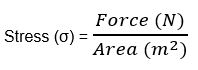
Stress is in (N/m2 or Pa)
Stress applied to a material can be of two types. They are:
- Tensile Stress: It is the force applied per unit area which results in the increase in length (or area) of a body. Objects under tensile stress become thinner and longer.
- Compressive Stress: It is the force applied per unit area which results in the decrease in length (or area) of a body. The object under compressive stress becomes thicker and shorter.
What is a Strain?
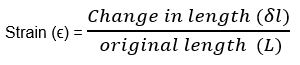
The strain is defined as the amount of deformation experienced by the body in the direction of force applied, divided by initial dimensions of the body.
The formula for calculating strain in material testing:
Depending on stress application, strain experienced in a body can be of two types. They are:
- Tensile Strain: It is the change in length (or area) of a body due to the application of tensile stress.
- Compressive Strain: It is the change in length (or area) of a body due to the application of compressive strain
Stress and Strain
Whenever a load is placed on a material, it will produce stress and strain in the material. For example, like a tennis ball. When you try to press it, it will produce force. The force offered will cause stress while the change in dimension represents the strain. When applying force that leads to deformation, a material tries to retain its body structure by setting up internal stresses.
How is a Stress-Strain Curve Plotted?
The most common method for plotting a stress and strain curve is by using a Universal Testing Machine. Place the specimen into grips. Clamp specimen at the top of the grip first then carefully clamp the sample into the bottom grip. Attach the extensometer to the specimen. Start the material test by pulling the specimen at a uniform rate. The force applied and the strain produced is recorded until a fracture occurs. The two parameters are then plotted on an X-Y graph to get the familiar graph.
Stress-strain curve
The stress-strain curve is a graph that shows the change in stress when strain increases. The stress and strain curves for brittle, hard, metallic and plastic materials are different. This graph is widely used in various industries. It is used as a reference in material science and manufacturing. Under different loads and material, the stress and corresponding strain values are plotted. The following is an example graph of a stress-strain curve:
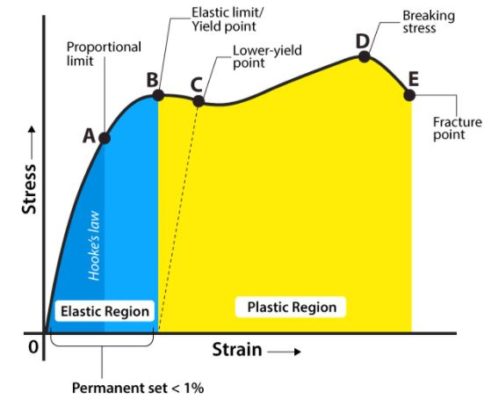
There is a various point on the stress and strain curve described above. It describes the different behaviours that occur during material testing. The stress-strain graph has different points or regions as follows:
- Proportional limit
- Elastic limit
- Yield point
- Ultimate stress point
- Fracture or breaking point